Merry Christmas all!!!
Some updates:
Last week I sold off 2 trading positions and 1 holdings as I wasn't feeling comfortable holding too much equities at this time.
Sold off:
1) Cordlife. Had vested at 54c about 2 weeks ago and sold off at 55.5c as it proved to be a stubborn resistance. I had intially vested as I thought I was seeing an Elliot Wave 5 forming... It's still possible as long as 51c isn't breached
2) PCI: I mentioned that this was good to hold with dividends and a chance of privatisation by Chuan Hup. But I just felt too heavily invested in the market and decided to reduce my positions. I sold off at 46c although I bought at an average of 46.8c. However, I collected 3c worth of dividends during the time. Resistance remains at 50c
3) Interra. I bought Interra at 39c on 14th Dec as I saw an triangle with a chance of a breakout later since it was consolidating. Subsequently it did make a big move on 21st December and hit 41.5c before closing back at 40.5c. The breakout of the triangle is at >41c. Closing below showed the breakout had failed this time. Thus I threw my lots at 40.5 as I didn't see much buying at 41.5 anyway..
Holdings left in my stash:
1) 35lots of Foreland @ 9.9c
2) 100lots of Infinio @ 1c
3) 1 lot of Wilmar @ $4.98 (kept as a reminder to be discipline in cutting losses)
4) 1 lot of Wilmar (CPF) @ 3.10 (vested for long term)
5) 4 lots of Wheelock @ $1.975 (vested for long term potential)
6) 10 lots of China Merchant Pacific @ $0.755 (bought to build dvd portfolio)
7) 300 lots of Digiland (CPF) @ 0.1c (more of a tikam haha)
Tuesday, 25 December 2012
Saturday, 15 December 2012
Off topic rant on Singtel and Starhub
I just wrote the following complain email to IDA.... just too frustrating as a customer.
Background
I had be previously been a Starhub Hub club subscriber and started to terminate both the broadband and cable tv subscriptions as I no longer required them. I had kept my Starhub digital voice number active as my parents still use the land number. Subsequently, I decided to cancel this digital voice subscription and move it back to Singtel (it was originally a Singtel number) to replace my current MioTV number. The logic was that, there was no point for me to keep 2 numbers and paying for both when the MioTV number was solely just used for the TV and not used for telephony reasons.
I went down to Singtel "Hello" shop in Westmall around the first week of November to query about making the change and what I needed to do. The queuing took me quite awhile as Iphone 5 was just launched and they didn't have a priority queue for customers who wanted other services other than mobile. I was told to do the following:
1) Cancel Starhub digital voice so that the number can be returned to Singtel.
2) Come back again after it's cancelled so that they can do the processing to streamline my 2 numbers to 1.
3) The number would be unavailable for use during the time of change
Note: Singtel cannot do the number porting on behalf of the customer and requires the customer to liase with Starhub on this. (I'm quite curious why this can't be done between the Telcos since they can easily do it for Mobile lines)
Thus, I went to cancel my starhub line on the 14th November.
After about 1+ week, I went back to Singtel Westmall to check as I happen to be around. They told me that the number hasn't been returned and they can't do anything until Starhub returns the number. She told me to next time call up Starhub to check before wasting time and queuing up again.
This morning, a couple of things happened:
1) I called Starhub to check if the number has been returned to Singtel. The CSO told me over the phone that the number had been deactivated since 16th November and that they have no control over the number.
2) Thus I called Singtel to check since now Starhub is claiming that the ball is in Singtel's court. I explained to the CSO what had happened and was advised that I was to proceed to a Hello shop and complete a Number Porting form to do the porting from Starhub to Singtel. I was very frustrated at this time and was wondering why didn't Singtel tell me this weeks back when I was there??
3) I went back to Singtel Westmall and was served by a friendly CSO (Alvin). I explained my situation and he duly filled in the number porting form. But as he was completing the form, he noted that my number was still with Starhub and told me to get Starhub to cancel the number porting since the number was originally from Singtel. As he went to check with his manager, I took the opportunity to call Starhub and a CSO (Fu Xiang) answered. He repeated to me that the number had already been cancelled and that he needed to check with the operations staff why the number wasn't transferred back. He said he will drop an mail to the department and will inform me once the change is effected. After the call, Alvin advised me that the number returning can take between 2weeks to 3 months!! And that the bottleneck is at Starhub.
Please advise if you can help to expedite this request as it is UNREASONABLE to be required to wait 2 weeks to 3 months just for a simple transferring of numbers. I personally 1 week is already very generous. Imagine, if I'm expecting an important call and number previously provided was now the invalid number? My Dad is also seeking employment and runs the risk of the potential employers calling this invalid number! I feel that I have been very patient with this as it has already been more than 1 month and I have yet to even submit the form to streamline the 2 phone numbers.
Friday, 14 December 2012
Update on Foreland
First thing first, yes i'm still holding Foreland at 9.9c as mentioned in my post early in March.
Small-investment-foreland
Today, foreland (or forlan as EDMW calls it), made a big surge of almost 25% ! This was following a smaller surge of about 10% the day before. What caused this surge? Probably sector rotation play since China Taisen, Qingmei and even Eratat did big moves today.
The mistake I made was that I was lazy and didn't go ahead to analyse on Foreland's Q3 results (as opposed to what I told myself to do). I had initially wanted to wait for the Q3 results and decide if I wanted to average down. And looking back, I probably might have taken the risk to do so at about 3.0-3.5c... Let me try to present my FA based view on this.
Firstly, let me start by saying that the slide of Foreland is inline with what the whole fabric industry is experiencing. Tighter margins and as a result, losses are made. The executive chairman had also dump some of his holdings during this time.
However, there's a saying that knowledge that FA will provide support and form a base/turning point.
In this case, the turning point was about 3c.
Now let's look at Q3's results.
1) P&L:

Net loss after tax was RMB ~920k. I personally had expected a bigger loss but am still confident that the company will become profitable since the comparison quarter's profits was RMB 54million! The only concern here is the small margin from sales and cost of sales.
2) B/S: This is what I was looking for.

Total Liabilities: RMB ~51million
Cash and cash equivalents: RMB 317million
Supposedly, Foreland need to pay out all current and non-current liabilities right now. Foreland would still have RMB 266million in CASH alone. We aren't even factoring in receivables and fixed assets at all.
 Group borrowings are ZERO.

Number of issued shares at end of Q3 is 542,424,199.
If we take the RMB 266m above (after liabilities) and work out the cash per share, it works out to RMB 0.49 per share! (Assuming RMB 5 = SG$1, we have about close to 10cents per share!) The share price when the Q3 results were released was only 3.3c! This alone should have been enough motivation to buy more if you believe the accounts to be true. The auditors are Baker Tilly (whom are a mid tier audit firm)
Lastly, if you like to look at NAV, it's currently at RMB 1.28 = SGD 0.256...

Sigh... Now I can only look on and consider I should average some now or if I should wait for retracement to keep more...
Small-investment-foreland
Today, foreland (or forlan as EDMW calls it), made a big surge of almost 25% ! This was following a smaller surge of about 10% the day before. What caused this surge? Probably sector rotation play since China Taisen, Qingmei and even Eratat did big moves today.
The mistake I made was that I was lazy and didn't go ahead to analyse on Foreland's Q3 results (as opposed to what I told myself to do). I had initially wanted to wait for the Q3 results and decide if I wanted to average down. And looking back, I probably might have taken the risk to do so at about 3.0-3.5c... Let me try to present my FA based view on this.
Firstly, let me start by saying that the slide of Foreland is inline with what the whole fabric industry is experiencing. Tighter margins and as a result, losses are made. The executive chairman had also dump some of his holdings during this time.
However, there's a saying that knowledge that FA will provide support and form a base/turning point.
In this case, the turning point was about 3c.
Now let's look at Q3's results.
1) P&L:

Net loss after tax was RMB ~920k. I personally had expected a bigger loss but am still confident that the company will become profitable since the comparison quarter's profits was RMB 54million! The only concern here is the small margin from sales and cost of sales.
2) B/S: This is what I was looking for.

Total Liabilities: RMB ~51million
Cash and cash equivalents: RMB 317million
Supposedly, Foreland need to pay out all current and non-current liabilities right now. Foreland would still have RMB 266million in CASH alone. We aren't even factoring in receivables and fixed assets at all.


Number of issued shares at end of Q3 is 542,424,199.
If we take the RMB 266m above (after liabilities) and work out the cash per share, it works out to RMB 0.49 per share! (Assuming RMB 5 = SG$1, we have about close to 10cents per share!) The share price when the Q3 results were released was only 3.3c! This alone should have been enough motivation to buy more if you believe the accounts to be true. The auditors are Baker Tilly (whom are a mid tier audit firm)
Lastly, if you like to look at NAV, it's currently at RMB 1.28 = SGD 0.256...

Sigh... Now I can only look on and consider I should average some now or if I should wait for retracement to keep more...
Tuesday, 4 December 2012
Nov month end STI and Reits update.
Note that the "dividend stocks" prices are not updated. Only the STI and REITS prices are updated till 30th Nov.


Tuesday, 27 November 2012
Sheng Siong supermarket!

Sheng Siong staged a breakout yesterday on high volume. It had hit 50c by midday and there wasn't much action until the last 15mins where 50.5c got eaten up.
It looks like a nice triangle breakout with target around 55c.
We shall see if this turns into true. I'm vested with only 10lots at 50.5c
Thursday, 1 November 2012
STI Reits Yields as at 31st Oct 2012


I have added some small interesting stocks to my REITs file for my own personal tracking. Please do your own research before simply relying on the yields calculated.
Also, to add... My PEC position turns out to be a false breakout and I had cut off my position at 70c. I'm still watching whether to cut the other yet.
The market seems to be ranging and finding a bottom within this range. Dow holds 13000 so far and S&P holds 1400. STI is also holding >3000 whilst HSI had hit a high of 21800+ earlier, now trading around 21600 region. Let's watch to see if there's a right shoulder forming for the US markets and if HSI will break the previous high.
Note: 6th Nov is the US Presidential elections.
Saturday, 6 October 2012
PEC flag breakout
I only noticed this potential setup yesterday night and it really broke out earlier today. I had initially wanted to collect some when it was still in the triangle but I only managed to collect 5lots at breakout point and another 5 on the way up. My average is about 74c.

Last night, I noticed this flag formation with a nice decrease in volume in the flag whilst having a strong long flagpole (15c!!) The breakout point was determined at 72.5c but I was thinking that breaking 73c would be safer. In the end, the 2nd set of 5 lots were loaded after 73c was broken... and it did break up really fast and convincingly too. Daily charts show nice strong volume on today's breakout. The red horizontal lines are fibonacci lines and today's closing of 75.5c is at the 23.6% retracement. It's on course to go test the 38.2% line which also happens to be the target price of this breakout.
Along the way there are some resistances like the natural 80c resistance as well as a falling gap which is to be closed at 82c. 85c could be a problem as it is near target zone plus it was the previous mini peak. My intention is take profit somewhere here if so allowed. I have checked both RSI and stocs and confirmed that they are not yet in the overbought zone and thus more upside to come... especially with such a bullish Dow tonight. However. oil has also dropped and may affect PEC to some extend.

Here's the weekly chart. We can see that the target zone is somewhere near 100 weekly MA... All in all, this target looks feasible.
Another sweetener is that PEC has 2.5c dividends which will XD on 8th Nov. I don't hope that it will take that long to reach target. Hopefully it hits target within the next week :)
Sunday, 30 September 2012


Thursday, 27 September 2012
New longer term investing position (PCI Ltd)
First thing first... That Chippac flew to 45c and I missed everything from 36.5c to 45c :(.
The power of a bounce from the perspective of a monthly chart, is indeed strong.
Anyway, I bought some small investing position yesterday.
My counter of choice: PCI Ltd.
From SGX:
This counter caught my eye sometime ago, but it's illiquid and not easy to buy or sell large positions. The thing that attracted me to this was:
A) a proposed 3c dividends that are to be announced
B) 76.78% holding by Chuan Hup (another listed co)
C) Strong balance sheet and cash position
Based on 30th June 2012 full year results, it has about US$40m in cash (about US$0.20 per share).
Total assets is at US$ 137m with US$40m in Accounts Receivables and the US$40m cash.
Liabilities at US$52m (almost all are current account payable liabilities).
Shares available is close to 200m shares. (used for simplicity)
As seen above, balance sheet is healthy with all liabilities easily met. It has zero borrowings. NAV is at US$0.42 (about SGD 0.50). The current price is close to NAV.
I bought in 10lots at an average of 47c after commission. The 3c proposed dividends will give me a yield of 6.38%, which is decent.
I went on to look at Chuan Hup's balance sheet and once again, this is a cash rich profitable company with little debt. It has US$81m in cash as part of total assets of US$368m. The liabilities weigh in at US$64m (almost all are current). From where, we can see that they can easily pay out the liabilities with cash alone.
Why am I looking at Chuan Hup? Well since Chuan Hup already holds 76.78% of PCI and had been accumulating PCI shares slowly since they failed to takeover the company in 2011 with an offer of S$0.50. The shares in which Chuan Hup doesn't hold in PCI is about 50m.
Assuming that Chuan Hup comes in to offer again but at S$0.60 per share, it would only cost the S$30m (about US$25m from their US$81m). Not to PCI would be paying out S$0.03 dividends of which Chuan Hup will get about S$4.5m. Taking over PCI will give them access to the US$40m cash that PCI currently holds (before dividends and liabilities). This gives a good case for a takeover. It's been a year after the previous offer lapse (21 June 2011) and thus Chuan Hup is able to mount another offer if they so chooses.
Lets wait and see if they will attempt to do so again.
The power of a bounce from the perspective of a monthly chart, is indeed strong.
Anyway, I bought some small investing position yesterday.
My counter of choice: PCI Ltd.
From SGX:
Background
This counter caught my eye sometime ago, but it's illiquid and not easy to buy or sell large positions. The thing that attracted me to this was:
A) a proposed 3c dividends that are to be announced
B) 76.78% holding by Chuan Hup (another listed co)
C) Strong balance sheet and cash position
Based on 30th June 2012 full year results, it has about US$40m in cash (about US$0.20 per share).
Total assets is at US$ 137m with US$40m in Accounts Receivables and the US$40m cash.
Liabilities at US$52m (almost all are current account payable liabilities).
Shares available is close to 200m shares. (used for simplicity)
As seen above, balance sheet is healthy with all liabilities easily met. It has zero borrowings. NAV is at US$0.42 (about SGD 0.50). The current price is close to NAV.
I bought in 10lots at an average of 47c after commission. The 3c proposed dividends will give me a yield of 6.38%, which is decent.
I went on to look at Chuan Hup's balance sheet and once again, this is a cash rich profitable company with little debt. It has US$81m in cash as part of total assets of US$368m. The liabilities weigh in at US$64m (almost all are current). From where, we can see that they can easily pay out the liabilities with cash alone.
Why am I looking at Chuan Hup? Well since Chuan Hup already holds 76.78% of PCI and had been accumulating PCI shares slowly since they failed to takeover the company in 2011 with an offer of S$0.50. The shares in which Chuan Hup doesn't hold in PCI is about 50m.
Assuming that Chuan Hup comes in to offer again but at S$0.60 per share, it would only cost the S$30m (about US$25m from their US$81m). Not to PCI would be paying out S$0.03 dividends of which Chuan Hup will get about S$4.5m. Taking over PCI will give them access to the US$40m cash that PCI currently holds (before dividends and liabilities). This gives a good case for a takeover. It's been a year after the previous offer lapse (21 June 2011) and thus Chuan Hup is able to mount another offer if they so chooses.
Lets wait and see if they will attempt to do so again.
Friday, 14 September 2012
Stats Chippac
I bought this counter on 29th August after I sold my Far East and forgot to blog about it. Today it moved to my surprise.


Above are the daily, weekly and monthly charts.
What prompted me to buy this stock was that it was still profitable, is about 80% owned by Temasek and near 2009 lows. I had seen the monthly chart that it was that low and a nice Bullish Divergence had formed. I was looking to be patient with this stock since it does show much potential for a strong reversal.
True enough, there was a strong high volume breakout today.
As can be seen by the daily, it blitz through 35c resistance of the daily 50MA as well as the highest high after the August selldown. Next resistance is 37c based in daily chart with 100MA around 38c.
From the weekly chart, we see that today's high of 36c coincides with 14ema for weekly. I generally use the zone between 14ema and 20ma as the long/short zone to bet on a continuation of the trend. As such, we are nearing serious resistance. The 20MA weekly is at 37.5c.. somewhere close to where we see resistance on daily. There's also a small bullish divergence on the MACD for weekly.
Now to the longer term investors, we can see the monthly chart has that tempting bullish divergence. The 14ema and 20ma for monthly are quite some distance away at 46.5c and 51.5c respectively...
Now I need to decide for myself, do I take profit around 37-38c or do I sit still based on the monthly charts...
Monday, 3 September 2012
Brief update on the month gone by
Not much action from me last month.
Made some $$ from the sale of Popular on Thursday before Jackson Hole. (Bought 22.5c and sold 23.5c)
I tried to queue to buy back at 23c but no luck getting any
Also managed to get some small lunch money from small short positions on CityDev and SembCorp (lasting about 1-2days on average).
I had managed to long Las Vegas Sands on 14th Aug, at $38.95 as I was sensing a move upwards. However, I got anxious and sold at $39.30 with small profit after commission. The stock eventually went up to as high as $43.87.. damn... :(
All part of the learning process I guess. Just shows I'm on the right track with my TA and I just gotta have more confidence in myself.
However, not all trades were rosy. I got impulsive when I heard ABR was giving 30c and went to hoot at a high of 98c matched at opening. I had tried to cancel my order before but I somehow entered the wrong password the first time around and when I was re-entering, my order was matched. Anyway, I have seen the financials of the company and believe it is strong just that there's no liquidity. Guess I'll be sitting on this for sometime.


Friday, 17 August 2012
A Couple of Charts as promised
SembCorp

Sembcorp hit 5.79 afew days ago. The last time it reached this price was on Apr 2011. (see weekly chart below).
It formed an inverted hammer lookalike candle on Tuesday. (long upper shadow and a small body.) The next day, it formed a "hammer lookalike candle" or rather, a hanging man candle. This might be sign of a top although I would have preferred a smaller candle body to the hanging man. Nonetheless, I decided to open a short at closing on Wednesday (@ $5.68). All these "toppish" looking candles require confirmation the following few days.
Today, it gave an almost solid black candle. This could be the bearish confirmation I was looking for, but the volume the last 2 days, have been short of the 14d average. Also, Dow is currently up +100 points because the markets are rallying on BAD DATA in hope there would QE3. (To me, this is ridiculous. It's like you are wishing the world becomes a worst place to live so that God will have no choice but to intervene and make everything better again...)
Anyways, immediate support would be around $5.40 where the 20MA and previous resistance turned support is. Cut loss will be if SembCorp is able to close at or above $5.80.

GLP

Same thing. GLP gapped up and formed that inverted hammer on the bearish STI day. This followed with a solid black candle today. MACD shows bearish divergence.

For mid to long term investors, the 13w EMA and the 26w EMA are still on the uptrend.
Saturday, 11 August 2012
Small update
I haven't been posting much since I'm still pretty unsure where STI is heading. As I mentioned before, I had expected STI to hit between 3050-3100 and it has duly done that.
I personally feel now is the time to do the following:
1) Take profits
2) Cut losses on any bounce (on those that have hit stop losses or those that seemingly look weak)
3) Sit on cash and wait for direction.
Right now, I have tried to reduce my trading positions and have only bought acceptable small positions on those counters that are:
1) undervalued and near support, (DMX at 22.5c... now is about 22c with support at 21.5-22c)
2) seemingly has something brewing underneath (Popular... main shareholder kept buying for the last few months and his wife just bought 800+lots on National Day eve)
3) sold down for no reason (China Animal Health. Suppose to be working on delisting offer at 30c. Sold down on a few thousand lots volume. Not sure if there's news that delisting might not go ahead)
I cut my KTL position which was a big mistake when I didn't sell for profit about a year ago.. end up stuck with low liquidity. Decided to bite the bullet and take the loss to retrieve whatever capital there is. I don't think the business is able to turn around any time soon as well.
I'm looking out for Far East Reits to invest for my now empty DVD portfolio...
I'll try to find sometime to post charts going forward
Wednesday, 1 August 2012


Monday, 23 July 2012
Interesting times ahead.
Quite sometime since I had the mood to post anything.
The last week showed STI breaking past the Mar-May highs, reaching almost 3040.
The question now is, have we completed wave 5? (which requires the move to have moved higher than 3031 the previous high). Are the big boys gonna let it retrace abit and push it up further since the other markets have yet to break March highs? Or have we completed wave 5 and just started wave A?
These are some questions to consider if you trade index stocks or stocks that mainly move with the index (note that micro pennies may not move with the index).
Trade safe!
Tuesday, 3 July 2012
Updates on STI components and Reits Yields


Sorry guys for no updates.
I was away for much of June. Church camp and a short holiday to Sydney to take a break from the hectic Singapore working life.
Anyways, the market was pretty much in a range and my opinion is that it currently looks like the start of "sucker rally 2". (The first being Jan to Mar). What do I mean by "sucker rally"? Well, lets just say I have the view that alot of retail investors are sidelined (as seen from the trading volumes) as they are uncertain of the road ahead. They may not have bought into the first rally earlier this year since the economy was looking pretty bad with all the negative news in 2nd half of 2011.
This 2nd rally is designed to lure in these sidelined investors so the financial institutions and funds can distribute their holdings. How do they do that? Well, they just keep pushing the prices up since volume is so thin and eventually retail investors might get itchy for fear of "missing the boat". This will continue to push prices higher until suddenly, everyone is vested and happy, with some capital gains unrealised. The big boys would have sold along the way up and at the top, buying will be only by retails and prices would only be able to slide down slowly but surely... Of course, news may speed up the dumping process and a market crash might occur.
Trade safe and be nimble!
Thursday, 7 June 2012
End May STI & REITS dividend yield updates.


*Current dividend porfolio (started May 2012):

I have a tendency to buy reits, collect dvd and sell after xd with some capital gain. I'm wondering if I will do better to hold for longer term instead of selling and looking to buy again at a lower price.
CityDev & STI

STI seems to have bottomed for now and is looking at rebound. The gap down was closed and target looks set to be around 2800 with 2770 as first resistance. 2800 is tricky as the 20MA, 20EMA, as well as a support turned resistance line currently stands. Failure to clear above the line would mean more down side.
2811 is interesting as it was the most recent high. If it manages to go above that, the failure of the lower high theory will suggest more upside to come.
Right now, Dow is rallying on hope that QE3 is coming. Hope can carry the market a long way but once it diminishes, the world can come crashing down...

I took an impulsive short position on Citydev on closing. I saw how much it gapped up between closing and matching period and decided to test the market with a small short. So far it closed at the upper resistance line and just below the 200ma. But with US rallying, it most probably will break up with prospects of it hitting around 10.40 region with the bollinger band and MA present.
Be nimble. I'll judge what to do when I wake up tomorrow morning and dow has closed.
Wednesday, 30 May 2012
Olam update

Olam supported by the red downtrend line... Still looks pretty bearish to me.
However, MACD histo is turning up so we might get a proper reversal soon.
Not vested.
After getting hit badly by Wilmar, I'm pretty much sidelined until I can make out what the market wants to do. Right now, I'm still of the opinion that it is consolidating in range before a big move up or down. I'm favouring another leg down (65% chance)
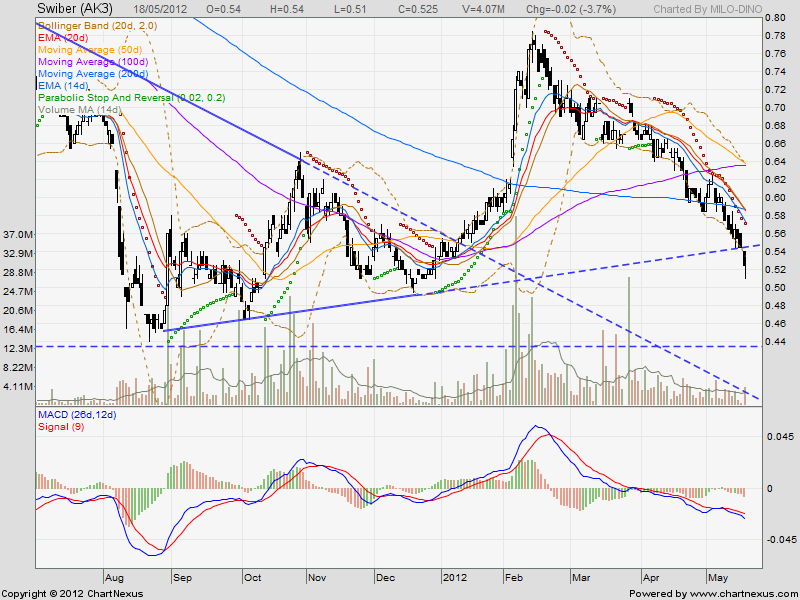
Monday, 21 May 2012
OSIM & Swiber

Saturday, 19 May 2012
Swee Heng IPO thoughs
Some points that I found interesting
Competitive Strengths:
Established and proven track record of more than 43 years
- Our track record of repeatedly winning public sector tenders
is testament to the quality of our services. Most of our revenue
is derived from our public sector works – 100% in FY2011,
and 97.2% in FP2012.
Prospects:
- BCA has indicated that construction demand from the public sector
in 2013 and 2014 is expected to range between S$12 billion and
S$15 billion per year.
- The new North-South Expressway - a dual three-lane, expressway
to serve the north-south corridor is expected to commence
construction in 2013 and be completed by 2020.
- A dual four-lane road in Bukit Brown, linking Thomson Road, Adam
Road and the Pan Island Expressway, is expected to commence
construction in early 2013 and be completed by 2016.
Auditors: Nexia TS Public Accounting Corporation
NAV after ipo 13.62c
Dividend Policy: We currently do not have a fi xed dividend policy. However, we intend to recommend and distribute dividends of at least 20% of our net profi ts after tax attributable to Shareholders for FY2012 and FY2013
Trade and other receivables: 31m of which 24m is from contracts. (note that govt always will inspect thoroughly before payment)
Cash: 9.2m
Total Assets: 52m
Total Liabilities: 17.5m
Post IPO shares: 368.5m
Interesting to note that this is a family business so shares would be tightly held and see little play with the freefloat. At most during IPO, it might be played for a couple of days.
It might be worth a punt based on ipo price but a float of 2.8m for public will make it tough to get a good allocation. Also, the markets have just started their downtrend, so might not be a good time to vest.
Thursday, 17 May 2012
Some charts and updates

Dow Jones just retested the 12712 support turned resistance and failed to breakup. This means we are probably seeing a double top with target around 12200.

STI has been falling quite severely with all the commodities being hit. Wilmar last week and Olam today.
Immediate support at 2821 and subsequent major support at 2785(?) region where the red trendline is. This is the line from 2009 low drawn to 2011's low.


Thursday, 10 May 2012
Wilmar...
I got hit big time today due to Wilmar's poor results.
Had vested 2 lots at 4.915 average and it closed 4.26 today.
It had looked to be on a rebound until the economical news around the world, took its toil.
 Zhun zhun hit the bottom of the weekly chart... but the week aint over as we still have tomorrow...
I guess I really should have thrown when 4.73 broke yesterday.. sigh... looks like I will have to baby sit this baby or at least sell half on the bounce.
Extra: I just noticed that before results in the past, if the results were going to be bad, the selling would have started 2-3 days before and generally there would have been a gap down the day before. Just something to note and might be useful in the future.
Had vested 2 lots at 4.915 average and it closed 4.26 today.
It had looked to be on a rebound until the economical news around the world, took its toil.

I guess I really should have thrown when 4.73 broke yesterday.. sigh... looks like I will have to baby sit this baby or at least sell half on the bounce.
Extra: I just noticed that before results in the past, if the results were going to be bad, the selling would have started 2-3 days before and generally there would have been a gap down the day before. Just something to note and might be useful in the future.
Just for Laughs!

Next they changed it to the bottom....

I love Simpsons!! Credit to Fox
Wednesday, 9 May 2012
DJI and S&P update


Monday, 7 May 2012
DVD stocks update
After some fierce selling today, I shall post some dividend yields as at end April


Subscribe to:
Posts (Atom)