Nuffnang ad

Friday 27 April 2012

Another potential Ascending Triangle?


I'll leave you to decide.... Breakout at 18.67-70.

F&N Ascending triangle breakout?


It looks like a breakout to me... I bought some at closing. See if it comes true.
Potential target $8?

From Stockcharts.com:

"The ascending triangle is a bullish formation that usually forms during an uptrend as a continuation pattern. There are instances when ascending triangles form as reversal patterns at the end of a downtrend, but they are typically continuation patterns. Regardless of where they form, ascending triangles are bullish patterns that indicate accumulation.

Because of its shape, the pattern can also be referred to as a right-angle triangle. Two or more equal highs form a horizontal line at the top. Two or more rising troughs form an ascending trend line that converges on the horizontal line as it rises. If both lines were extended right, the ascending trend line could act as the hypotenuse of a right triangle. If a perpendicular line were drawn extending down from the left end of the horizontal line, a right triangle would form. Let's examine each individual part of the pattern and then look at an example.

Trend: In order to qualify as a continuation pattern, an established trend should exist. However, because the ascending triangle is a bullish pattern, the length and duration of the current trend is not as important as the robustness of the formation, which is paramount.

Top Horizontal Line: At least 2 reaction highs are required to form the top horizontal line. The highs do not have to be exact, but they should be within reasonable proximity of each other. There should be some distance between the highs, and a reaction low between them.

Lower Ascending Trend Line: At least two reaction lows are required to form the lower ascending trend line. These reaction lows should be successively higher, and there should be some distance between the lows. If a more recent reaction low is equal to or less than the previous reaction low, then the ascending triangle is not valid.

Duration: The length of the pattern can range from a few weeks to many months with the average pattern lasting from 1-3 months.

Volume: As the pattern develops, volume usually contracts. When the upside breakout occurs, there should be an expansion of volume to confirm the breakout. While volume confirmation is preferred, it is not always necessary.

Return to Breakout: A basic tenet of technical analysis is that resistance turns into support and vice versa. When the horizontal resistance line of the ascending triangle is broken, it turns into support. Sometimes there will be a return to this support level before the move begins in earnest.

Target: Once the breakout has occurred, the price projection is found by measuring the widest distance of the pattern and applying it to the resistance breakout."

Wednesday 25 April 2012

Update on yesterday's Dow and S&P


Above is the Dow chart... look at how it bounced nicely off the trendline again.... Shows the uptrend is strong but testing the same line too many times will cause it to fail eventually.. Dow needs to close above 13050 20ma tonight. Currently it is at about 13030 which isn't far off.


The S&P varies however, when I draw the trendline. It looks as if the line has broken and the support turns to resistance (about 1376 tonight).

Hence, it really is reliant on Apple's results later tonight, to determine the mood tomorrow..

Tuesday 24 April 2012

STI sideways market still (my opinion)


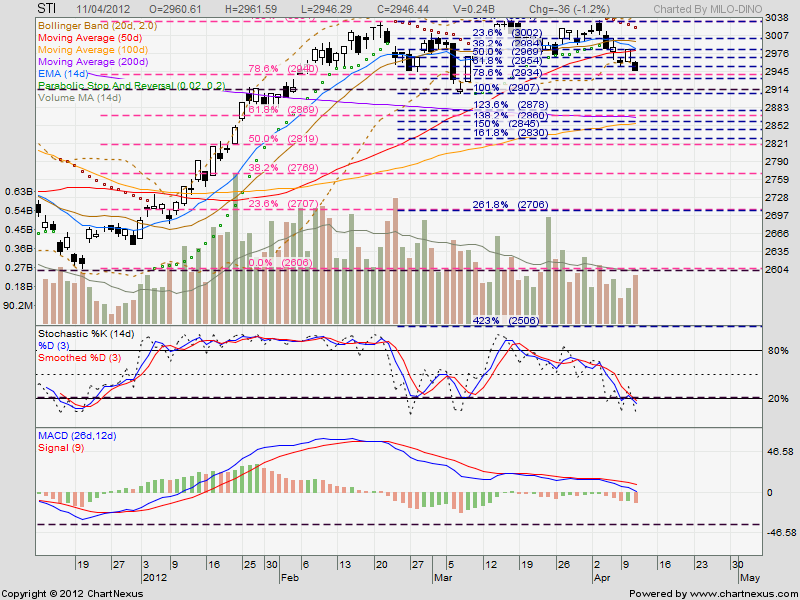
Here we have the daily chart. The black trend line which I just drew, looks to be the support today as well. The fibo 61.8% support is there as well (based on the low at 2907).
There's quite a fair chance that we might see STI re-testing 2900 soon. That support must hold to have at least a sideways market with a bullish bias-ness.


This is the weekly chart with the blue fibo lines removed. Here we see the 13 and 26ema weekly still trending up. This show that it's still mid to long term bullish. The 13ema seems to coincide with the support given today. Critically, the 20ma is at 2900 (which I deem to be a key point at this moment).

Right now, every dip is a buy as long as STI remains above 2900. 38.2% fibo at 2872 will also prove to be a support if 2900 is broken. I will consider this key fibo support as the last support and if this is broken, it might be better to get out and sit on cash. (if you are brave, you can even short).

Sunday 22 April 2012

Sakari

Some of my forum friends have asked my opinion on Sakari. Thus i'll repost what I told them


Sakari.. first support is 1.99... followed by 1.90-1.87.... then 1.80

My weekly chart shows more downside as the 13weekly just crossed the 26weekly EMA. This might suggest a long term downtrend might be forming.

On the daily, the MACD don't show any signs of turning. The histogram never turned up to positive. This suggest more downside.
Best is wait for it to turn positive (break the bear's back), then after that when it turns down and form a new low, a bullish divergence will form. Only then, when the rebound starts, it will be the time to long.

If not, even the daily chart shows those bigger black candle days, have larger volume then those small movement or up days....

I personally wouldn't touch unless u wanna play intraday for 1-2 bids kind

Friday 13 April 2012

DJI rebound?


Dow is currently up 140 points. Based on charts, it bounced off the black trend line support. (lows of Mar and Jun'11 as well as Oct's top)

Immediate resistance at 12987 (50ma) 13033 (14ema), 13115 (20ma)

For those risk adverse, can stay sidelined until the 20ma is cleared. Indicators still look a tad bearish. But the strong rebound might suggest that the bull might continue.

Thursday 12 April 2012


I see an ascending triangle that just broke out today. Too bad I didn't react in time to it.
It did show some signs of strength since it continues to trade at the top of the triangle with little reaction.

Based on theory, the upside from 11.13 is another $1.80, which brings use close to $13 potentially.
But based on fibonacci, the immediate target would be $11.64 to 11.70 region (which was part of the shoulders in last Apr/May).

After hours, there was news of a US$4bn letter of intent by a customer, and this might be the cause of the move.

Trade safe!

Some charts for consideration


Wednesday 11 April 2012

Closed my shorts

I closed my shorts on CMA and Golden this morning.
Market had looked like it was poised for a rebound and thus I closed. Golden lost one bid by closing at 0.795 (it looked like it was waiting for bumi agri's IPO before bursting up). CMA closed at 1.575 (4 bids profit)

Intra-day, I longed SGX at 6.69 and closed it off at 6.74 before closing. Somehow it didn't feel right.

Europe and US just got hit badly.. and we might see STI back to the 2955 and maybe even 2915 today.

Trade safe

Friday 6 April 2012

Shorted GoldenAgri and CMA

On Thursday, I shorted both GoldenAgri (79c) and Capmallasia ($1.595)

As posted on earlier, Golden seems to have hit the upper channel and looks due to reverse. However, with BurmiAgri IPO happening next week, Golden may just react positively... so I'll have a tight stop just above 80c.


CMA looks to have broken down below the trend line.There also looks to be shorting going on as well. We shall see how it performs. I noted that when STI flipped to a positive on Thursday's trading, CMA did recover but very little.. it shows that it is weak although the body of the candle is small. Monday will give a hint of it's strength/weakness.

On Thursday night, Dow managed to close above 13000. A strong break of this support  will push it down further to 12700ish.

Trade safe!

Thursday 5 April 2012

CMA and Goldenagri Charts

2 counters which I might short...


Wednesday 4 April 2012

Updates on dividend yields

Here's my updated monthly REITS and STI components dividend yields sheet.
Abit late this month due to work commitments.


In March, I reopened my dividends portfolio. I had previously sold off my 1 lot of SGX to realise the capital gains and thus wanted to load some to my empty portfolio. I bought the following which should be enough for the year (unless the market goes into a deep correction):

10 lots of Cambridge REIT @ 53c
5 lots of Mapletree Ind Trust @ $1.09

Industrial reits seem to perform better as a whole. Do note that Cache has had a 2c special div due to some new placement of 60million shares @ 98.5c